How to Find the Mode If There Are Two Modes?
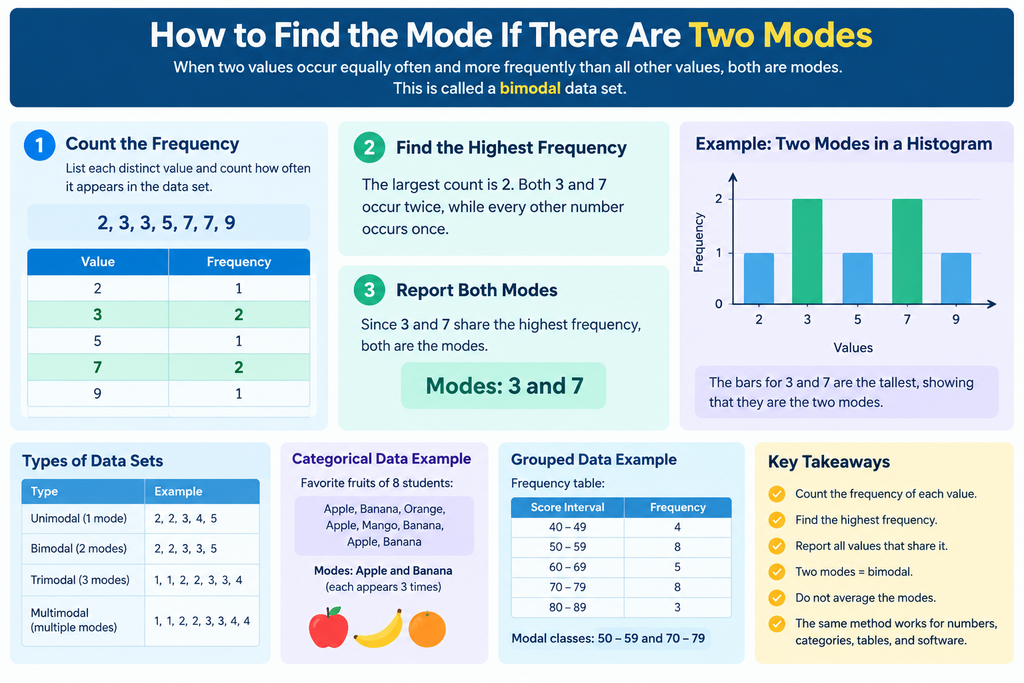
If you are trying to understand how to find the mode if there are two modes, the answer is simple: both values are modes if they occur equally often and more frequently than every other value in the data set. A data set with exactly two modes is called bimodal. You do not need to choose one value over the other, and you should not calculate their average to find the mode. Instead, count how often each value appears and identify the two values with the highest frequency. In this guide, you will learn the three-step method, follow worked examples, understand frequency tables and histograms, and discover how to find multiple modes using calculators and spreadsheet tools.
Quick Answer: The 3-Step Method
To find the mode when there are two modes, count the frequency of every distinct value, identify the highest frequency, and report every value that reaches that frequency. When exactly two values tie for the highest count, both are modes.
Quick answer
If two different values occur equally often and more frequently than all other values, both values are modes. This is called a bimodal data set.
Example: \(2, 3, 3, 5, 7, 7, 9\)
The number 3 appears twice, and the number 7 appears twice. Every other number appears once.
Answer: Modes = 3 and 7.
Step 1: List the Values and Count Each One
Start by examining the entire data set. Write down each distinct number and count how many times it occurs. This count is known as its frequency. If your data contains repeated values, make sure you count every occurrence rather than counting each distinct number only once.
Step 2: Find the Highest Frequency
Compare the frequency of every value. The largest count determines which values qualify as modes. For example, if most numbers occur once, while two numbers occur four times each, the highest frequency is four.
Step 3: Report Both Modes
If exactly two values share the highest frequency, report both of them as the modes. If three or more values share the highest frequency, report all the tied values instead. The important rule is that the mode depends on frequency, not on the size of the numbers.
What Does It Mean to Have Two Modes?
The mode in statistics is the value that appears most frequently in a data set. Unlike the mean, which is calculated by adding values and dividing by their count, or the median, which identifies the middle value after sorting the data, the mode focuses on repetition.
Sometimes, one value occurs more frequently than every other value. In other cases, two values share the highest frequency. When this happens, the data set has two modes, making it bimodal. This is a valid statistical result, not a calculation error.
For example, consider the numbers \(4, 4, 6, 6, 8, 10\). Both 4 and 6 appear twice, while 8 and 10 appear once. Therefore, the modes are 4 and 6. The data set has two modes because these values are tied for the greatest frequency.
Here are the common terms used to describe the number of modes.
| Type of data set | Meaning | Example |
|---|---|---|
| Unimodal | One mode | 2, 2, 3, 4, 5 |
| Bimodal | Two modes | 2, 2, 3, 3, 5 |
| Trimodal | Three modes | 1, 1, 2, 2, 3, 3, 4 |
| Multimodal | Multiple modes | 1, 1, 2, 2, 3, 3, 4, 4 |
These terms describe how many values share the highest frequency. A data set can also have no mode when every value occurs equally often. Understanding these distinctions makes it easier to solve statistics questions correctly, whether you are working with a short number list, a school assignment, or a larger collection of data.
Worked Example: Finding Two Modes in a Number Set
Let’s work through the most common type of question you might see in a math exam. Suppose you are given the following data set:
\[ 2,\ 3,\ 3,\ 5,\ 7,\ 7,\ 9 \]
The question asks you to find the mode. At first glance, you might think that 3 is the answer because it appears twice. However, 7 also appears twice, so you must compare the frequencies of all the values before making your final decision.
Create a frequency table to make the calculation easier.
| Number | Frequency |
|---|---|
| 2 | 1 |
| 3 | 2 |
| 5 | 1 |
| 7 | 2 |
| 9 | 1 |
The highest frequency is 2. Both 3 and 7 occur twice, while every other number occurs only once. Therefore, neither value occurs more frequently than the other.
Final answer: The modes are 3 and 7.
This example demonstrates the essential rule for finding two modes. You do not need to select the smaller number, select the larger number, or calculate an average. Both values are equally important because they share the highest frequency.
A Longer Example With a Frequency Table
Now consider a slightly larger data set:
\[ 4,\ 6,\ 6,\ 8,\ 9,\ 9,\ 9,\ 10,\ 10,\ 10,\ 12,\ 12,\ 12 \]
This example is particularly useful because three different values appear three times or more. To find the modes, count the occurrences rather than assuming that the largest number or the most noticeable number is the answer.
| Value | Frequency |
|---|---|
| 4 | 1 |
| 6 | 2 |
| 8 | 1 |
| 9 | 3 |
| 10 | 3 |
| 12 | 3 |
The highest frequency is 3. The values 9, 10, and 12 each occur three times, so the data set has three modes rather than two.
Final answer: The modes are 9, 10, and 12.
Notice that this is a trimodal data set. The same counting method works whether you have one mode, two modes, or several modes. You simply identify every value that shares the highest frequency.
Finding Two Modes in Categorical Data
The mode is not limited to numbers. You can also find the most frequent category in survey responses, product preferences, favorite colors, educational qualifications, and other types of information. This makes the mode useful when the values represent labels rather than quantities.
Imagine that a teacher asks eight students to name their favorite fruit. Their answers are:
Apple, Banana, Orange, Apple, Mango, Banana, Apple, Banana.
Count the responses to identify the most popular choices.
| Fruit | Number of responses |
|---|---|
| Apple | 3 |
| Banana | 3 |
| Orange | 1 |
| Mango | 1 |
Apple and Banana each received three responses. No other fruit received as many votes, so both categories are modes.
Answer: The modes are Apple and Banana.
This is an example of a bimodal categorical data set. It tells us that two fruit choices are equally popular among the students surveyed. It does not mean that every student likes both fruits or that the two fruits are identical in any other way.
You can apply the same process to educational levels, preferred subjects, transportation methods, or customer feedback categories. Count each category, compare the totals, and report all categories tied for the greatest frequency.
One important distinction is that you should not calculate the mean of categories such as Apple and Banana. These are labels, not numerical measurements. For categorical information, the mode is often the most appropriate measure of central tendency because it identifies the most common response directly.
Finding Two Modes in a Frequency Table or Grouped Data
Sometimes, a question gives you a frequency table instead of a list of individual observations. In this situation, you do not need to count every value from scratch because the frequencies are already provided. Your task is to identify the largest frequency and determine which value or class corresponds to it.
Consider the following frequency table.
| Number | Frequency |
|---|---|
| 1 | 4 |
| 2 | 7 |
| 3 | 5 |
| 4 | 7 |
| 5 | 2 |
The largest frequency is 7. Both the value 2 and the value 4 have this frequency.
Answer: The modes are 2 and 4.
What If the Table Uses Class Intervals?
Grouped data presents a slightly different situation. Instead of listing individual values, the table organizes observations into intervals. For example, a teacher might record examination scores in ranges such as 40 to 49, 50 to 59, and 60 to 69.
Suppose the table looks like this:
| Score interval | Frequency |
|---|---|
| 40 to 49 | 4 |
| 50 to 59 | 8 |
| 60 to 69 | 5 |
| 70 to 79 | 8 |
| 80 to 89 | 3 |
The highest frequency is 8, and two class intervals share that frequency. Therefore, the modal classes are 50 to 59 and 70 to 79.
When working with grouped data, report the class intervals as the modal classes rather than claiming that the exact individual scores are known. The table tells you how many observations fall into each interval, but it does not reveal the precise frequency of every individual score inside that interval.
For example, you can say that the intervals 50 to 59 and 70 to 79 are tied for the highest frequency. You cannot conclude from this table alone that 55 and 75 are the exact modes of the original observations.
This distinction is important in examinations because a question involving grouped frequency distributions may expect modal classes rather than exact numerical modes.
Two Modes vs. a Bimodal Distribution
The terms two modes and bimodal distribution are closely related, but they describe slightly different ideas.
Two modes refer to two distinct values that share the highest frequency in a data set. A bimodal distribution, in the context of a distribution graph, usually refers to a shape with two distinct peaks. One describes the frequency of individual values, while the other describes the overall pattern of the data.
Imagine that you record the heights of a group of people. If the group contains two substantial clusters, perhaps because it combines two different populations, a histogram might show two peaks. The graph may suggest that the data contains two underlying groups rather than one concentrated around a single typical value.
Here is a simplified illustration of two peaks.
Example of a bimodal distribution
Illustrative histogram with two peaks, not real measured data.
Lower values
Higher values
The two visible peaks indicate two concentrations of observations. The exact shape depends on the data and the intervals used to build the histogram.
Can One Peak Be Higher Than the Other?
Yes. In a histogram, one peak can be taller than the other. People sometimes call these the major and minor peaks, meaning the larger and smaller visible peaks. A distribution with two clear peaks can still be described as bimodal even when those peaks have different heights.
However, there is a subtle distinction. In a raw data set, two modes mean two individual values tie for the highest frequency. In a histogram, two peaks refer to concentrations across intervals, and the tallest bars do not necessarily have identical frequencies.
For example, a histogram might show one peak containing 40 observations and another containing 25. These peaks are unequal, but the distribution can still have two distinct concentrations. You should not confuse this situation with a raw data set in which two exact values have equal maximum counts.
Can Histogram Bin Width Change the Result?
Yes. The bin width, or the size of each interval used in a histogram, can affect the shape you see. Wider intervals can combine nearby concentrations and hide a second peak. Narrower intervals may reveal more detail, but they can also make random fluctuations look like meaningful peaks.
For this reason, use a sensible bin width and consider the context of your data before deciding that a distribution has two meaningful peaks. A histogram is a tool for understanding the pattern, not a guarantee that two distinct underlying groups exist.
Common Mistakes When Finding Two Modes
Finding two modes is usually straightforward, but a few common mistakes can lead to incorrect answers. Understanding these errors will help you solve school questions accurately and interpret statistical results more confidently.
Mistake 1: Averaging the two modes.
Suppose the modes are 4 and 8. Their average is 6, but that does not make 6 the mode. The mode is determined by the most frequent observations, not by averaging the values that tie. Unless a question specifically asks you to calculate the mean of two numbers, report both modes separately.
Mistake 2: Reporting only one mode.
If two values share the highest frequency, giving only one leaves out part of the correct answer. Always compare the counts before writing your result. If 5 and 9 each occur four times, the answer must include both 5 and 9.
Mistake 3: Saying there is no mode when two values tie.
A tie does not mean the data set lacks a mode. It means there are multiple modes. When two values share the highest frequency, the data is bimodal. When three values share it, the data is trimodal.
Mistake 4: Confusing two modes with no mode.
Consider the data set \(1, 2, 3, 4, 5\). Every value appears once, so there is no uniquely most frequent value. By contrast, \(1, 1, 2, 2, 3\) has two modes because both 1 and 2 appear twice, which is more frequently than 3.
Mistake 5: Choosing the largest value.
The mode is not necessarily the largest number. In the set \(2, 4, 4, 7, 9, 9\), both 4 and 9 are modes. The correct answer comes from counting, not from choosing the highest numerical value.
The best habit is to create a frequency table whenever you are unsure. A simple table makes repeated values easy to compare and reduces the risk of overlooking a second or third mode.
How to Find Multiple Modes With Software
When a data set contains hundreds or thousands of observations, counting every value manually can take time. Spreadsheet applications and programming languages can calculate the mode automatically, including cases where several values share the highest frequency. The main thing to remember is that not every function returns every mode, so you should choose a tool that matches your goal.
Finding Two Modes in Excel
Microsoft Excel provides the MODE.MULT function to return the most frequently occurring numerical values. It is especially useful when a data set has two or more modes and you want to avoid counting the observations manually.
Suppose your data is stored in cells A2 through A8:
| Cell | Value |
|---|---|
| A2 | 2 |
| A3 | 3 |
| A4 | 3 |
| A5 | 5 |
| A6 | 7 |
| A7 | 7 |
| A8 | 9 |
To find the modes, enter this formula into an empty cell:
=MODE.MULT(A2:A8)In modern versions of Excel that support dynamic arrays, the results can appear in separate cells automatically. For this example, Excel returns 3 and 7 because both values occur twice.
In older versions, you may need to select a vertical range of cells and confirm the formula using Ctrl + Shift + Enter. The exact steps depend on the Excel version you use.
One common mistake is using MODE.SNGL when you need all tied modes. That function returns a single mode rather than a list of all tied values. Also, if every number appears only once, MODE.MULT returns a #N/A error because there is no repeated value with a higher frequency.
Finding Two Modes in Google Sheets
Google Sheets also supports the MODE.MULT function, making it possible to find multiple modes without manually building a frequency table.

Google Docs Editors Help
+1
If your values are stored in cells A1 through A7, enter:
=MODE.MULT(A1:A7)For the data set \(2, 3, 3, 5, 7, 7, 9\), the formula returns 3 and 7. If your spreadsheet supports array results, the modes appear in separate cells.
If the results cannot expand because other information occupies the required cells, clear the obstructing cells or move the formula to an empty area. This can resolve an output obstruction, sometimes called a spill problem. If the data contains no repeated values, the function can return an error rather than a numerical mode.
For a small homework question, a manual frequency table is usually sufficient. For a larger spreadsheet, MODE.MULT saves time and helps you identify every value tied for the highest frequency.
Finding Two Modes in Python
Python is useful when you need to analyze data programmatically. Its built in statistics module includes a function specifically designed to return all modes.
import statisticsdata = [2, 3, 3, 5, 7, 7, 9]modes = statistics.multimode(data)print(modes)Output:
[3, 7]The statistics.multimode() function returns a list containing every value with the highest frequency. It also works with categorical data, such as strings representing colors or fruit choices.
Python 3.12.15 documentation
For example, if your data is ["red", "blue", "red", "blue", "green"], the function returns both "red" and "blue".
Python also provides statistics.mode(), but that function returns a single mode. In modern Python versions, when several values tie, it returns the first mode encountered in the data. If your task requires every mode, use statistics.multimode() instead.
Python 3.12.15 documentation
Finding Two Modes in R
R is another programming language used for statistical analysis. One important detail is that the base R function mode() does not calculate the statistical mode. It identifies an object’s storage type, so using it for this purpose can produce a result different from what you expect.
You can write a small custom function to find every statistical mode:
find_modes <- function(x) {
  counts <- table(x)
  counts[counts == max(counts)]
}

data <- c(2, 3, 3, 5, 7, 7, 9)

find_modes(data)
The function counts the observations and returns the values whose frequencies equal the highest count. For the example data, the result identifies 3 and 7, each with a frequency of two.
This method is useful when analyzing repeated observations in an R workflow. If you need the output to contain only the mode values rather than their counts, you can use names() around the result:
names(find_modes(data))For categorical data, the same idea works with character values, provided the input is handled consistently. As always, check the structure of your data before interpreting the output.
Using an Online Mode Calculator
An online mode calculator can be a convenient option when you have a short list of numbers and want a quick answer without opening a spreadsheet or writing code. Enter the values, run the calculation, and check whether the result contains one mode, two modes, several modes, or no mode.
For the best result, choose a calculator that explicitly supports multiple modes. Some tools display only one result even when two values tie, so it is worth checking how the calculator handles repeated values. You can verify its answer by counting the frequencies manually, especially when completing homework or preparing for an examination.
A calculator is useful for checking your work, but understanding the method is more valuable than memorizing a button or formula. If you know how to identify the highest frequency, you can solve the same problem with paper, Excel, Google Sheets, Python, or another suitable tool.
Why Does Data Have Two Modes?
A data set may have two modes because two values are equally common, but the reason behind that pattern depends on the information being collected. Sometimes, the tie is simply a feature of the sample. In other situations, two modes can provide clues about different groups or processes within the data.
Imagine that a school collects scores from two versions of an examination. One version may be easier, while the other may be more challenging. If the scores cluster around two different values, the overall data set might show two modes or two peaks in a histogram.
A similar pattern can occur when information from different groups is combined. For example, a business might record the number of customers arriving during morning and evening rush hours. Combining both periods could create two concentrations of arrival times. Separating the observations by time period may reveal patterns that are less obvious in the combined data.
Two modes can also arise in manufacturing. Suppose two machines produce the same component, but one machine consistently produces measurements around one value while the second produces measurements around another. Combining both machines’ output could create a bimodal pattern. Examining each machine separately may help identify why the measurements differ.
However, two modes do not automatically prove that two separate groups exist. A small sample can produce tied frequencies by chance, and a histogram’s shape can be influenced by how the intervals are chosen. You should consider the context, sample size, measurement process, and data collection method before drawing conclusions.
When the distinction matters, divide the data into meaningful groups and calculate their frequencies separately. Compare the results, examine a histogram, and investigate whether the groups differ in a way that explains the pattern. This approach turns a simple observation about frequency into a more useful statistical insight.
Should You Still Use the Mean and Median?
Yes. A data set with two modes can still have a meaningful mean and median, but those measures answer different questions. The mean represents the arithmetic average, the median identifies the middle observation in sorted data, and the mode identifies the most frequent value or values.
Consider this data set:
\[ 1,\ 1,\ 2,\ 2,\ 9,\ 9,\ 10,\ 10 \]
The modes are 1, 2, 9, and 10 because each appears twice. The mean is:
\[ \frac{1+1+2+2+9+9+10+10}{8}=5.5 \]
The median is also 5.5 because the two middle values are 2 and 9, and their average is 5.5.
Yet 5.5 does not appear in the data set at all. It also does not describe either of the two visible clusters particularly well. The lower values are concentrated around 1 and 2, while the higher values are concentrated around 9 and 10.
This example shows why a single average may not tell the whole story. The mean and median are mathematically correct, but they can hide the fact that observations are concentrated in separate regions.
When reporting bimodal or multimodal data, consider including the following information in your explanation:
- Both modes, so readers know which values occur most frequently.
- A histogram or frequency table, so readers can see how the observations are distributed.
- The mean and median, when they are relevant to the question.
- Group level summaries, when there is a meaningful reason to separate the observations.
The best summary depends on your objective. If you are asked to find the mode in a school exercise, report the tied values. If you are analyzing a real data set, investigate the distribution before deciding which statistics provide the most useful description.
Special Cases When Finding the Mode
Not every data set follows the same pattern. Understanding a few special cases will help you distinguish between two modes, multiple modes, and data sets that have no mode.
What If Every Value Appears Equally Often?
Consider the data set:
\[ 2,\ 4,\ 6,\ 8,\ 10 \]
Each value appears exactly once. No value occurs more frequently than the others, so there is no unique mode under the usual school definition.
The same principle applies if every value appears twice. For example, \(1, 1, 2, 2, 3, 3\) has no unique mode under the strict definition because all three values share the same frequency. Some statistical conventions describe all three as tied modes, but in many introductory mathematics courses, the expected answer is no mode when every observation occurs equally often. Follow the convention specified by your teacher or textbook.
What If There Are Three or More Modes?
A data set can have any number of modes if multiple values share the highest frequency. Consider:
\[ 1,\ 1,\ 3,\ 3,\ 5,\ 5,\ 7 \]
The numbers 1, 3, and 5 each appear twice, while 7 appears once. Therefore, the data set is trimodal, and the modes are 1, 3, and 5.
The counting method does not change when more modes appear. Find the highest frequency, then report every value that reaches it. Do not stop after identifying the first two values.
Does Sample Size Matter?
A small data set can have two modes simply because several values occur the same number of times. In a larger data set, two modes may reflect a more persistent pattern, but the number of observations alone does not prove that the pattern is meaningful.
For example, two tied values in a class of eight students may reflect a small sample. Two distinct peaks in a much larger data set might suggest different groups, but you would still need to examine the context and distribution before drawing conclusions.
The important distinction is between identifying modes correctly and explaining why those modes occur. Frequency counting answers the first question; statistical interpretation helps answer the second.
Practice Problems With Answers
Try these five questions to check your understanding of how to find the mode if there are two modes. Work through each question before revealing the answers.
Test your knowledge
Five practice questions covering numbers, categories, frequency tables, and interpretation.
Question 1: Find the modes
Find the mode or modes of the following data set:
\(4,\ 4,\ 6,\ 6,\ 8,\ 10\)
Question 2: Categorical data
A survey records these favorite colors: red, blue, green, red, blue, yellow, red, blue. Which color or colors are the modes?
Question 3: Frequency table
Find the mode or modes from this table.
| Value | Frequency |
|---|---|
| 2 | 3 |
| 4 | 6 |
| 6 | 4 |
| 8 | 6 |
| 10 | 2 |
Question 4: Make the set bimodal
Add one number to the data set \(2, 2, 3, 4, 4, 5\) so that the resulting data set has exactly two modes. What number should you add?
Question 5: Interpret the result
A shop records daily sales of 5, 5, 8, 8, 8, 12, 12, 12, 15. What are the modes, and how many times does each occur?
Reveal all answers
Question 4 illustrates an important exam skill: sometimes the condition in a question cannot be satisfied with the permitted change. The original data set already has two modes, 2 and 4. Adding one number to it cannot remove either of those ties, so a third mode may be created, but the result cannot have exactly two modes. Always verify your final data set instead of assuming a suggested change works.
Conclusion: Finding Two Modes Made Simple
Finding two modes is easy once you understand the role of frequency. Count each distinct value, identify the highest frequency, and report every value that shares it. When exactly two values tie for the highest frequency, the data set is bimodal, and you should report both modes rather than averaging them or choosing just one. The same principle applies to categorical data, frequency tables, and software tools. To strengthen your statistics skills, explore a guide to the mean, median, and mode, then practise with a mode calculator or downloadable worksheet.
Frequently Asked Questions
Yes. A data set can have two modes when two distinct values occur equally often and more frequently than all other values. For example, \(2, 2, 5, 5, 7\) has two modes: 2 and 5. Both values appear twice, while 7 appears once.
A data set with exactly two modes is called bimodal. The term describes a situation in which two values share the highest frequency. In a histogram, a bimodal distribution generally has two distinct peaks.
No. You do not add or average two modes to determine the mode of the data set. You report both values separately. If the modes are 4 and 8, the correct answer is 4 and 8, not 6.
A histogram can have two peaks of different heights and still be described as bimodal if both represent distinct concentrations in the distribution. However, two modes in a raw data set require two individual values to share the highest frequency. These are related but different meanings.
Yes. The mode can be used with categorical information such as colors, fruit preferences, or survey answers. Count how often each category appears, then report the category or categories with the highest frequency. You cannot calculate a meaningful arithmetic average of text categories.