How to Figure Out the Mode in Math
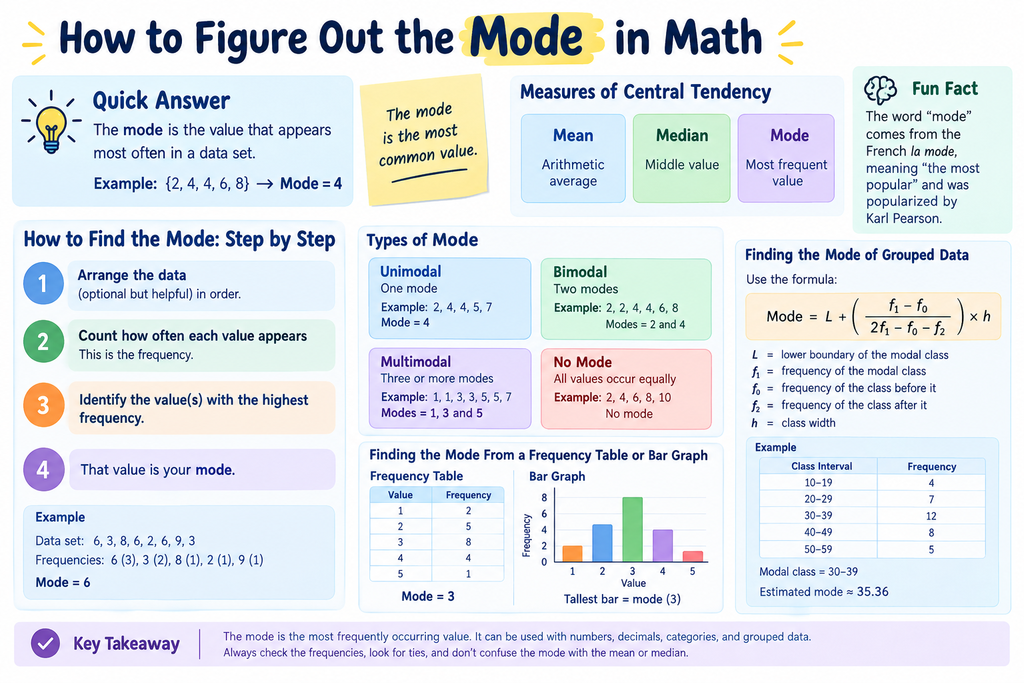
Quick Answer: The mode is the value that appears most often in a data set. For example, in {2, 4, 4, 6, 8}, the mode is 4 because 4 occurs more times than any other value.
What Is the Mode in Math?
The mode in math is the value that occurs most frequently in a collection of numbers or observations. If you have a data set and want to know which value appears more often than the others, you are looking for the mode. Unlike the mean, which requires adding values and dividing by the number of observations, finding the mode usually involves simply counting how many times each value occurs. This makes the mode one of the easiest measures of central tendency to understand, especially when you are working with small lists of numbers.
The mode is one of the three commonly taught measures of central tendency: mean, median, and mode. Each one describes the center or typical part of a data set in a different way. The mean gives you the arithmetic average, the median gives you the middle value after arranging the data, and the mode tells you the most frequently occurring value. For example, consider the numbers 3, 5, 5, 6, 8. The value 5 appears twice, while every other number appears once, so the mode is 5. The idea is simple: when you hear the word “mode,” think most common value.
The mode can also be useful when your data is not made up of numbers. Suppose a survey asks 20 students about their favorite school subject and the most common answer is Mathematics. Mathematics is the mode of those responses. This is one reason the mode is especially useful in surveys, market research, product analysis, and other situations where the data consists of categories rather than numerical measurements.
How to Find the Mode Step by Step
If you want to know how to find the mode of a data set, you can use a simple process. Start by looking at all the values, determine how frequently each value appears, and then identify the value with the greatest frequency. Sorting the numbers first is not mathematically required, but it can make repeated values much easier to spot, particularly when you are dealing with a longer list.
For example, imagine you have the data set 6, 3, 8, 6, 2, 6, 9, 3. The number 6 occurs three times, 3 occurs twice, and the remaining values occur once. Therefore, the mode is 6. You do not need to calculate an average or find a middle position. You simply compare the frequencies and choose the value with the highest count.
Step 1: Arrange the Data
The first step is to arrange the values in numerical order when you are working with numbers. This step is optional, but it can make the repeated values easier to recognize.
Take this example:
8, 3, 5, 3, 9, 3, 7
After arranging it:
3, 3, 3, 5, 7, 8, 9
Now the three occurrences of 3 are immediately visible. Arranging the data is particularly helpful when you are learning how to find the mode of a list of numbers, because repeated values appear next to each other.
Step 2: Count the Frequency
Next, count how many times every distinct value appears. The number of times a value occurs is called its frequency.
For the previous example:
| Value | Frequency |
|---|---|
| 3 | 3 |
| 5 | 1 |
| 7 | 1 |
| 8 | 1 |
| 9 | 1 |
The highest frequency is 3, and that frequency belongs to the value 3.
Step 3: Identify the Highest Frequency
Finally, identify the value associated with the highest frequency. That value is the mode.
In our example, 3 occurs three times, which is more than any other number. Therefore:
Mode = 3
If two or more values share the highest frequency, do not choose only one. The data set may be bimodal or multimodal, depending on how many values are tied.
Worked Examples of Finding the Mode
Understanding the definition is useful, but examples make the process much clearer. The key is to recognize that the same basic idea works whether you have five numbers, twenty numbers, decimal values, or even categories such as colors. Only the amount of counting changes.
Mode of a Simple List
Consider:
3, 7, 7, 9, 10
Count each value:
- 3 appears once.
- 7 appears twice.
- 9 appears once.
- 10 appears once.
Since 7 has the highest frequency, the answer is:
Mode = 7
Notice that the numbers do not have to be arranged before you can find the mode. If the original list were 10, 7, 3, 7, 9, the answer would still be 7.
Mode of a Large Data Set
When learning how to find mode in a large data set, the main challenge is not the definition. It is avoiding counting errors. With dozens or hundreds of values, manually scanning the list can become difficult, especially when the same numbers are spread throughout the data.
Consider this smaller version of a larger data set:
12, 15, 18, 12, 20, 15, 12, 17, 18, 12, 21, 15
The frequencies are:
| Value | Frequency |
|---|---|
| 12 | 4 |
| 15 | 3 |
| 18 | 2 |
| 17 | 1 |
| 20 | 1 |
| 21 | 1 |
The highest frequency is 4, so the mode is 12.
For a genuinely large data set, a frequency table, spreadsheet, or calculator can reduce the possibility of missing repeated values. The mathematical principle does not change just because the data set becomes larger.
Mode With Decimals
You can also find the mode with decimals. Decimal values are treated just like whole numbers: count how many times each exact value appears.
For example:
2.5, 3.1, 2.5, 4.7, 3.1, 2.5
Here, 2.5 appears three times, 3.1 appears twice, and 4.7 appears once.
Therefore:
Mode = 2.5
Be careful with decimal precision. For example, 2.50 and 2.5 represent the same numerical value, so they should normally be treated as the same value when determining the mode.
Mode of Categorical Data
The mode is not limited to numerical data. You can use it for categorical data, where the values represent groups or labels.
Imagine a survey asks people to select their favorite color:
Blue, Green, Blue, Red, Blue, Yellow, Green
Blue occurs three times, Green occurs twice, and Red and Yellow occur once.
Therefore:
Mode = Blue
This is particularly useful because you cannot meaningfully calculate the arithmetic mean of categories such as colors, brands, or favorite sports. The mode gives you a straightforward way to identify the most common response.
Types of Mode
Not every data set has exactly one mode. Depending on the frequency of its values, a data set can be unimodal, bimodal, multimodal, or have no mode. Recognizing these different situations is important because simply finding one repeated number may not always give the complete answer.
Unimodal, Bimodal, and Multimodal Data
A unimodal data set has one mode. For example:
2, 4, 4, 5, 7
The number 4 occurs twice while every other value occurs once, so 4 is the only mode.
A bimodal data set has two modes with the same highest frequency. For example:
2, 2, 4, 4, 6, 8
Both 2 and 4 occur twice, while the other values occur once. Therefore:
Modes = 2 and 4
A multimodal data set has three or more modes. For example:
1, 1, 3, 3, 5, 5, 7
Here, 1, 3, and 5 each occur twice. Therefore, the data set has three modes.
The important rule is that a mode must have the highest frequency. A value that appears more than once is not automatically a mode if another value occurs more frequently.
When a Data Set Has No Mode
A data set has no mode when no value occurs more frequently than the others. For example:
2, 4, 6, 8, 10
Every value occurs exactly once, so there is no value that is more common than the rest.
Another example is:
1, 1, 2, 2, 3, 3
Every value occurs twice. Since all values share the same frequency, there is no single value that stands out as the most frequent. In elementary and introductory statistics, this situation is generally described as having no mode.
This is an important distinction. Some students assume that the first number that appears twice must be the mode. That is not necessarily true. You must compare the frequency of every distinct value before deciding.
How to Find Mode From a Frequency Table or Bar Graph
A frequency table can make finding the mode much easier because the counting has already been organized for you. Instead of scanning the original data set, look at the frequency column and identify its largest number. The corresponding value is the mode.
For example:
| Number | Frequency |
|---|---|
| 1 | 2 |
| 2 | 5 |
| 3 | 8 |
| 4 | 4 |
| 5 | 1 |
The largest frequency is 8, and it belongs to 3. Therefore:
Mode = 3
The same principle works with a bar graph. If the horizontal axis shows values and the vertical axis shows frequency, the tallest bar represents the mode. You do not need to calculate anything complicated. Find the category or value associated with the tallest bar and read it from the horizontal axis.
For example, if a bar chart shows the number of students receiving different test scores and the tallest bar is above a score of 80, then 80 is the mode. This makes the mode particularly easy to identify visually.
How to Find the Mode of Grouped Data
Finding the mode becomes slightly different when the original observations have been organized into class intervals. Grouped data might look like 10–19, 20–29, 30–39, and so on. Because you do not know the exact individual values inside each interval, you cannot simply count repeated values in the same way as you would with raw data.
The first thing to identify is the modal class, which is the class interval with the highest frequency. For example, if the interval 40–49 contains 15 observations and every other interval contains fewer observations, then 40–49 is the modal class.
For an estimate of the mode of grouped data, statistics commonly uses the grouped-data mode formula:
Mode = L + [(f₁ − f₀) / (2f₁ − f₀ − f₂)] × h
Here, each symbol has a specific meaning:
- L = lower boundary of the modal class
- f₁ = frequency of the modal class
- f₀ = frequency of the class before it
- f₂ = frequency of the class after it
- h = width of the class interval
The formula gives an estimated mode rather than an exact raw-data mode because the individual observations within each class are not known.
Worked Grouped Data Example
Suppose the frequency table is:
| Class Interval | Frequency |
|---|---|
| 10–19 | 4 |
| 20–29 | 7 |
| 30–39 | 12 |
| 40–49 | 8 |
| 50–59 | 5 |
The modal class is 30–39, because its frequency of 12 is the largest.
Using the class boundaries, the lower boundary is 29.5. The relevant frequencies are:
L = 29.5
f₁ = 12
f₀ = 7
f₂ = 8
h = 10
Substituting these values into the formula gives an estimated mode of approximately 35.36.
The exact answer can vary slightly depending on the convention used for class boundaries and how the grouped data was constructed. The key idea is that the mode of grouped data is estimated from the modal class and the frequencies around it.
Mode vs Mean vs Median
The mean, median, and mode all describe central tendency, but they answer different questions. Choosing the right measure depends on the type of data and what you want to understand.
| Measure | What it tells you | Best used when |
|---|---|---|
| Mean | Arithmetic average | Numerical data without extreme distortion |
| Median | Middle value | Data is skewed or contains outliers |
| Mode | Most frequent value | You want the most common value or category |
Consider this data set:
2, 3, 3, 4, 8
The mode is 3 because it occurs twice. The median is also 3, because 3 is the middle value after sorting the data. The mean is 4, because the total is 20 and there are five values.
Now imagine adding a very large value:
2, 3, 3, 4, 100
The mode remains 3 and the median remains 3, but the mean becomes 22.4. This demonstrates why the mean can be strongly affected by extreme values, while the mode is based only on frequency.
The mode can also handle categorical information, while mean and median generally cannot. If a clothing store wants to know the most frequently purchased shoe size, for example, the mode can answer the question directly.
Common Mistakes When Finding the Mode
One common mistake is confusing the mode with the mean or median. The mode is not the average and it is not necessarily the middle number. It is simply the value with the highest frequency.
Another mistake is assuming that every data set has exactly one mode. A data set can have two modes, several modes, or no mode. Always check the frequencies of all distinct values before writing the final answer.
Students also sometimes stop counting after finding a value that appears twice. That can produce an incorrect answer if another value appears three or four times. With a long list, creating a frequency table is often a safer approach.
A few habits can prevent most errors:
- Count every distinct value.
- Check for ties.
- Do not confuse frequency with the value itself.
- Remember that a mode can be a decimal or category.
- For grouped data, identify the modal class before applying the formula.
- For bar graphs, look for the tallest bar.
Free Mode Calculator
A mode calculator can be useful when you have a large collection of values and want to check your result quickly. Instead of manually counting every occurrence, you can enter the data and let a calculator organize the frequencies.
This is especially helpful for students checking homework, teachers preparing examples, or anyone working with a long list of observations. However, using a calculator should not replace understanding the underlying method. Once you know that the mode means the most frequently occurring value, you can verify whether the calculator’s result makes sense.
For a small data set, manual calculation is often faster. For a large data set, a calculator or spreadsheet can save time and reduce counting mistakes.
Real Life Applications of Mode
The mode appears in many practical situations because people often want to know what is most common rather than what is average. A retailer, for example, might analyze sales and discover that a particular shoe size is purchased more frequently than all other sizes. That information can help the business decide how many units of each size to keep in stock.
In surveys and market research, the mode can reveal the most common response. If a survey asks customers which product color they prefer, the most frequently selected color is the mode. This gives researchers a quick way to identify the strongest preference.
Sports statistics can also use the concept. A coach might examine the most common score, jersey number, or performance category in a collection of observations. Weather researchers could identify the most frequently recorded temperature within a particular range, while manufacturers can analyze the most common product size or measurement.
The strength of the mode is its simplicity. It answers a practical question: What occurs most often? Whenever that is the question, the mode can be an appropriate measure.
Key Takeaways
The mode in math is the value that occurs most frequently in a data set. Finding it usually requires counting how many times each value appears and selecting the one with the highest frequency.
Remember these core rules:
- Mode means most frequent.
- Arrange the data if doing so makes counting easier.
- Count the frequency of every distinct value.
- The highest frequency determines the mode.
- A data set can have one mode, two modes, several modes, or no mode.
- The mode can be used with numbers, decimals, and categorical data.
- In a frequency table, look for the highest frequency.
- In a bar graph, the tallest bar identifies the mode.
- For grouped data, identify the modal class and use the grouped-data formula when an estimated mode is required.
- Do not confuse the mode with the mean or median.
Once you understand the simple idea of most frequently occurring value, even large and more complicated data sets become much easier to handle.
Conclusion
Learning how to figure out the mode in math is mainly about one simple idea: finding what occurs most often. Whether you are working with a short list of numbers, decimals, a frequency table, a bar graph, categorical responses, or a large data set, the fundamental process remains the same. Count the occurrences, compare the frequencies, and identify the value or category with the highest frequency.
The more advanced case is grouped data, where individual values are unavailable and the mode must be estimated using the modal class and an appropriate formula. Understanding the difference between raw data and grouped data helps you choose the correct method instead of applying the same calculation everywhere. Once you can distinguish the mode from the mean and median, you have a solid foundation for working with measures of central tendency.
Frequently Asked Questions
What is the mode in mathematics?
The mode is the value that occurs most frequently in a data set. For example, in 2, 3, 3, 5, 7, the mode is 3 because it appears twice and every other value appears once.
How do I find the mode of a small or large data set?
For a small data set, count how many times each value appears and choose the value with the highest frequency. For a large data set, organizing the values into a frequency table or using a calculator or spreadsheet can make the counting easier and reduce errors.
Can a data set have more than one mode?
Yes. If two values have the same highest frequency, the data set is bimodal. If three or more values share the highest frequency, it can be described as multimodal.
What does it mean if a data set has no mode?
A data set has no mode when there is no uniquely most frequent value. For example, if every number occurs exactly once, there is no mode. Similarly, if all values occur the same number of times, there is no single most frequent value.
How is mode different from mean and median?
The mean is the arithmetic average, the median is the middle value after the data is ordered, and the mode is the most frequently occurring value. The mode is especially useful when you want to identify the most common value or when the data consists of categories rather than numerical measurements.
How do you find mode from a histogram or bar chart?
Look for the tallest bar and identify the value or category represented by that bar. Since the height represents frequency, the tallest bar corresponds to the highest frequency and therefore identifies the mode.
Can mode be used for non-numeric data?
Yes. Mode can be used with qualitative or categorical data such as colors, brands, types of products, or survey responses. The category that occurs most frequently is the mode.