When you work with numbers, finding an average is often the first step toward understanding what those numbers mean. A teacher may want to know the typical marks in a class, a business owner may want to examine sales figures, or a student may need to summarize a set of statistics for an assignment. Although people commonly use the word “average” to describe the arithmetic mean, statistics offers several ways to identify a typical value. The median average calculator focuses on one of the most useful of these measures: the median.
The median is the central value in a dataset after the numbers have been arranged in order. If there are an odd number of observations, one number sits in the middle. If there are an even number of observations, the median is found by averaging the two central values. This simple method can be particularly helpful when a dataset includes unusually high or low values, because the median is less influenced by extreme observations than the arithmetic mean. Educational resources from the Open University and the Australian Bureau of Statistics describe the median, mean, and mode as distinct measures of central tendency, each suited to different kinds of data analysis.
In this guide, you will learn how to use a median average calculator, understand the difference between the mean, median, and mode, calculate the average percentage of marks, and solve common statistics questions step by step. You will also discover why the median can tell a different story from the mean and how the interquartile range helps you understand the spread of your data.
What Is a Median Average Calculator?
A median average calculator is a mathematical tool that determines the median of a group of numerical values. You enter a list of numbers, and the calculator arranges them conceptually or internally from smallest to largest before identifying the central position. Some tools also provide the mean, mode, range, minimum, maximum, and quartiles, allowing you to examine several aspects of a dataset at once. The central purpose, however, is to find the number that divides ordered data into two parts.
Imagine that five students receive the following marks:
45, 62, 71, 84, 96
The values are already arranged in ascending order. The third value is 71, so the median is 71. Two students have marks below this value, and two have marks above it. Now imagine that one student receives an exceptionally high score of 150 in a different type of dataset. The median may remain relatively stable even though the mean increases. This is one reason researchers and analysts often examine the median when data are unevenly distributed.
A median calculator is useful because it reduces the chance of making a counting or ordering mistake. It is especially helpful when you are working with a long list of observations, decimal values, repeated numbers, or data that are not initially arranged. Nevertheless, a calculator should support your understanding rather than replace it. Knowing why the median is calculated in a particular way makes it easier to check whether the answer is reasonable.
Why the Median Matters in Statistics
The median is called a measure of central tendency because it describes the center of an ordered dataset. Central tendency gives a summary of a collection of values using one representative number. The three commonly discussed measures are the mean, median, and mode, but they do not describe the data in exactly the same way. The mean uses every numerical observation in its calculation, the median depends on position, and the mode identifies the most frequently occurring value.
Consider the following monthly income figures:
| Person | Monthly income |
|---|---|
| A | 30,000 |
| B | 32,000 |
| C | 35,000 |
| D | 38,000 |
| E | 200,000 |
The mean is 67,000, while the median is 35,000. The unusually large income of 200,000 pulls the mean upward. The median remains at the middle observation, which is 35,000. Neither figure is automatically the “correct” answer in every situation. The mean describes the arithmetic average of these five values, while the median identifies the middle income in the ordered list.
This distinction matters when interpreting salaries, house prices, examination results, waiting times, and other measurements that may contain outliers. A good statistical report should clearly state whether it is presenting the mean or the median instead of using the word “average” without explanation.
How to Find the Median of a Dataset
Finding the median follows a straightforward process. First, collect the values you want to analyze. Next, arrange them from the smallest to the largest, or from the largest to the smallest. Finally, identify the central value or calculate the average of the two central values if the dataset contains an even number of observations.
For example, consider:
18, 7, 12, 25, 10
The numbers are not ordered. After sorting them, the dataset becomes:
7, 10, 12, 18, 25
There are five observations, and the third value is in the center. Therefore, the median is 12. Notice that the original order of the numbers did not affect the answer. What matters is their position after sorting.
For a dataset containing n observations, the median position for an odd number of values can be written as:
When the number of observations is even, the two central positions are:
and
The median is the arithmetic mean of the values in those two positions. These procedures are standard in introductory statistics and are also explained by university mathematics resources.
Finding the Median When There Is an Odd Number of Values
An odd dataset has a single central position. For example, suppose you have the following seven numbers:
4, 11, 8, 15, 6, 10, 20
First, sort the values:
4, 6, 8, 10, 11, 15, 20
There are seven numbers, so the median position is:
The fourth value is 10. Therefore:
The important point is that you do not add all seven values together and divide by seven when finding the median. That calculation would produce the mean. The median depends on the order and position of the observations.
If you are using a median average calculator, enter the numbers exactly as they appear in your question. The tool can then identify the middle position after sorting. If your answer differs from the calculator, check whether you accidentally used the mean formula or selected the wrong central value.
Finding the Median When There Is an Even Number of Values
An even dataset has two central values rather than one. In this case, you must find both middle numbers and calculate their arithmetic mean.
Consider the following eight values:
3, 9, 12, 5, 18, 7, 10, 20
Arrange them in ascending order:
3, 5, 7, 9, 10, 12, 18, 20
There are eight values. The two central positions are:
and
The fourth value is 9, and the fifth value is 10. The median is therefore:
The answer, 9.5, does not need to be one of the original observations. It is the midpoint between the two central values. This is an important difference between odd and even datasets. The Australian Bureau of Statistics explains that the median for an even number of observations is calculated from the two central values.
Mean, Median, and Mode Calculator
A mean, median, and mode calculator combines three common methods of summarizing numerical data. Using one tool can help you compare these measures and understand how the same dataset may produce different results. The mean is calculated from the total of the observations, the median comes from their central position, and the mode is the value that occurs most frequently. These are all measures of central tendency, but each answers a slightly different question.
Take the following dataset:
2, 4, 4, 6, 9
The mean is:
The median is 4 because it is the third value after sorting. The mode is also 4 because it appears twice, while every other value appears once.
| Measure | Result | Meaning |
|---|---|---|
| Mean | 5 | Arithmetic average |
| Median | 4 | Middle value |
| Mode | 4 | Most frequent value |
This example shows that the three measures do not have to be equal. A calculator that reports all three can provide a more complete picture of the dataset than a single average alone.
What Is the Mean?
The mean, also called the arithmetic average, is found by adding every numerical value and dividing the total by the number of observations. It is one of the most widely used statistical calculations because it incorporates every value in the dataset.
The average formula is:
Mean=Number of valuesSum of all values
For example, the mean of 12, 15, 18, and 25 is:
The mean is 17.5. This result is not necessarily one of the original values, which is perfectly acceptable. The mean represents the total distributed equally among all observations.
The main limitation of the mean is its sensitivity to extreme values. If one observation becomes much larger or smaller than the others, the mean may change substantially. The median is often more suitable when the data are skewed or contain outliers. However, the mean remains valuable when every observation should contribute to the calculation, such as when determining an overall academic average or calculating a total cost per item.
What Is the Mode?
The mode is the value that appears most often in a dataset. It can be useful when you want to identify the most common mark, product size, response, or measurement.
For example:
5, 7, 7, 8, 9, 7, 10
The number 7 appears three times, more than any other value. Therefore, the mode is 7.
A dataset may have one mode, more than one mode, or no mode. If two values occur equally often and more frequently than the other values, the dataset is bimodal. If every value appears exactly once, there is no unique mode.
The mode is different from the median because it does not depend on the middle position. It is also different from the mean because it does not require addition or division. For categorical information, such as favorite colors or preferred shirt sizes, the mode can be meaningful even though a numerical mean cannot be calculated.
Median Average Calculator Examples
Worked examples make the process easier to understand. The following problems show how to arrange numbers, identify central positions, and verify answers using the correct formula.
Median of the Numbers 1 to 10
A common question is: What is the median of 1, 2, 3, 4, 5, 6, 7, 8, 9, and 10?
The numbers are already in ascending order:
1, 2, 3, 4, 5, 6, 7, 8, 9, 10
There are ten values, so the dataset has an even number of observations. The two central positions are:
and
The fifth value is 5, and the sixth value is 6. The median is:
Therefore, the median of the numbers from 1 through 10 is 5.5.
This example demonstrates why you should not automatically select one middle number. There are two central values because the dataset contains ten observations. The arithmetic mean of all ten numbers is also 5.5 in this particular example, but that equality is a result of the evenly spaced data rather than a rule that applies to every dataset.
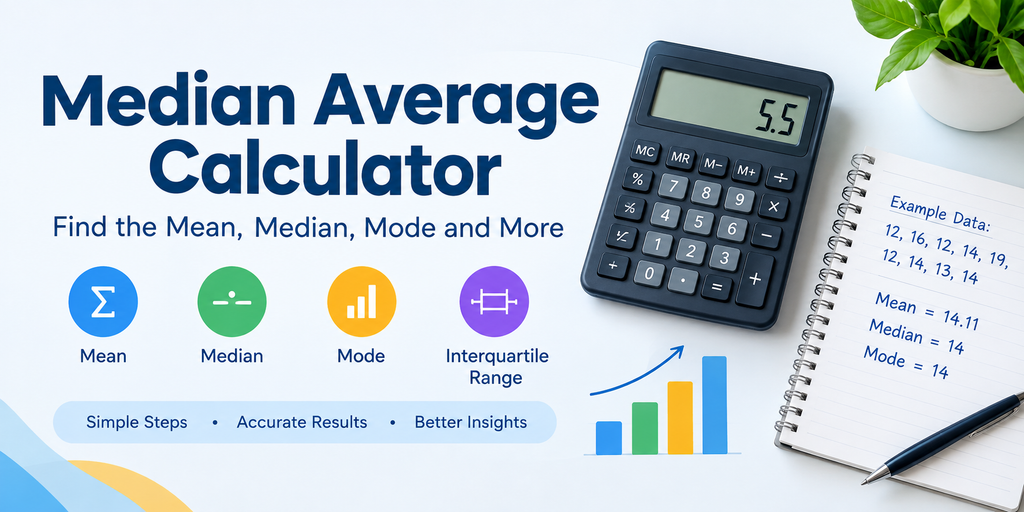
Median of 13, 16, 12, 14, 19, 12, 14, 13, 14
Let us solve the following question:
How do you find the median of 13, 16, 12, 14, 19, 12, 14, 13, 14?
First, arrange the values from smallest to largest:
12, 12, 13, 13, 14, 14, 14, 16, 19
There are nine observations, so the median position is:
The fifth value is 14. Therefore:
The mode is also 14 because it occurs three times. The mean is calculated separately:
The results are:
| Measure | Answer |
|---|---|
| Mean | 14.11 approximately |
| Median | 14 |
| Mode | 14 |
The repeated values make the mode easy to identify, while the ordered list makes the median clear. A calculator can confirm these results, but arranging the numbers manually is a useful way to understand the process.
Average Formula and Calculator Average
The word average is often used in everyday language to mean the arithmetic mean. In mathematics, however, it is important to clarify which type of average is being discussed. A median is an average in the broader sense of a representative central value, but it is not calculated by adding every observation and dividing by the count. The mean, median, and mode each have their own definition and purpose.
When someone asks for a “calculator average,” they may mean the mean of a set of values. If a student enters five marks into a basic calculator and divides their total by five, the result is the arithmetic mean. If the student instead sorts the marks and selects the central value, the result is the median. Both calculations are valid, but they answer different questions.
The arithmetic mean formula is:
Here, ˉ represents the sample mean, means the sum of the observations, and n represents the number of observations. The formula is useful for marks, measurements, expenses, sales, and many other numerical datasets.
How to Calculate Average Percentage
Average percentages can be calculated in different ways depending on what the numbers represent. If you have several percentages that are equally important, the arithmetic mean may be appropriate. If the percentages come from groups with different sizes, a weighted average may be more suitable.
Suppose three assignments have percentages of 60%, 75%, and 90%, and each assignment contributes equally. The average percentage is:
The average is 75%.
Now imagine that the percentages represent results from groups with different numbers of students. Simply averaging the percentages may give misleading results because each group does not contribute the same number of observations. In that case, the total number of marks earned should be divided by the total possible marks, or a weighted average should be used when the relevant weights are known.
For example, a student earns 40 out of 50 marks on one test and 70 out of 100 on another. The combined percentage is:
The simple average of 80% and 70% would be 75%, which is different because the tests have different maximum marks. The correct approach depends on whether you are averaging percentages equally or combining the underlying marks.
How to Calculate Average Percentage of Marks
To calculate the average percentage of marks, first determine whether all subjects have the same maximum marks. If every subject has an equal maximum, you can add the marks obtained, add the maximum marks, and divide the first total by the second. Multiply the result by 100 to express it as a percentage.
Suppose a student receives the following marks:
| Subject | Marks obtained | Maximum marks |
|---|---|---|
| Mathematics | 78 | 100 |
| English | 84 | 100 |
| Science | 72 | 100 |
| Computer Studies | 90 | 100 |
| Total | 324 | 400 |
The average percentage is:
The student’s overall percentage is 81%.
If the subjects have different maximum marks, use the combined total method. For example, suppose the student earns 45 out of 50 in one subject and 80 out of 100 in another:
This is the overall percentage across both assessments. It is not necessarily the same as taking the simple average of the two individual percentages. Understanding the difference prevents common mistakes when calculating examination results.
Understanding the Interquartile Range
The interquartile range, often abbreviated as IQR, describes the spread of the middle 50% of a dataset. While the median identifies the center, the interquartile range helps explain how widely the central observations are distributed. It is calculated by subtracting the first quartile, , from the third quartile, .
The formula is:
IQR=Q3−Q1
The first quartile is the point below which approximately 25% of the observations lie, while the third quartile is the point below which approximately 75% lie. The precise method used to calculate quartiles can vary between statistical conventions and software, so you should follow the method specified by your course or calculator.
Consider this ordered dataset:
2, 4, 5, 7, 8, 10, 12, 15, 18
The median is 8. Using the common method of finding the median of the lower half and upper half while excluding the overall median:
Lower half: 2, 4, 5, 7
Q1=4.5
Upper half: 10, 12, 15, 18
Q3=13.5
Therefore:
IQR=9
The interquartile range is 9. It shows the distance between the first and third quartiles and is less affected by extreme values than the full range. The IQR is frequently used alongside the median when describing skewed datasets or identifying potential outliers.
How to Calculate the Mean from Range and Median
A frequent statistics question asks: How can you calculate the mean from the range and median?
The important answer is that you generally cannot determine the exact mean from only the range and median. The range tells you the difference between the largest and smallest values, while the median identifies the central position. Neither measurement gives enough information about every observation to calculate the arithmetic mean.
For example, consider these two datasets:
Dataset A:
1, 5, 5, 5, 9
Dataset B:
1, 4, 5, 6, 9
Both datasets have a minimum of 1 and a maximum of 9, so their ranges are both 8. Both have a median of 5. However, their means are different:
Mean of A=5
Mean of B=5
These particular examples happen to have the same mean, so consider another pair:
Dataset C:
1, 1, 5, 9, 9
Dataset D:
1, 3, 5, 7, 9
Both have a range of 8 and a median of 5. The mean of Dataset C is 5, and the mean of Dataset D is also 5. To show why the information is insufficient, consider six observations instead:
Dataset E:
1, 2, 5, 5, 8, 9
Dataset F:
1, 4, 5, 5, 6, 9
Both have a range of 8 and a median of 5, but their means are:
Mean of E=5
Mean of F=5
These examples also happen to balance. The underlying principle remains that range and median alone do not establish the total sum of the observations. To demonstrate the difference more directly, use:
Dataset G:
0, 5, 5, 5, 10
Dataset H:
0, 4, 5, 6, 10
Both have a range of 10 and median of 5, and again the mean is 5. A more general way to see the limitation is to consider a dataset with an odd number of values:
0, 5, 5, 5, 10
The central value and endpoints do not tell you how the other values must be distributed in every possible dataset. The arithmetic mean requires the sum of all observations, not merely their central value and extremes. Therefore, unless additional information is supplied, such as the total sum, the complete dataset, or a special distributional assumption, the exact mean cannot be recovered from the range and median.
Common Mistakes When Calculating the Median
One of the most common mistakes is forgetting to arrange the data before finding the middle value. The median is based on the ordered dataset, not the order in which the numbers were originally written. If you select the middle number from an unsorted list, you may obtain an incorrect answer.
Another frequent error occurs when a dataset has an even number of values. Some students select the lower middle number or the upper middle number instead of averaging both. For example, in 2, 4, 6, 8, the median is not 4 or 6 alone. It is:
Confusing the median with the mean is another problem. The mean uses the sum of the observations, while the median uses their central position. A dataset may have a mean of 20 and a median of 12, particularly when a few large values raise the arithmetic average.
Repeated values can also cause confusion. Repetition does not change the basic method. Every observation counts, including duplicates. If a number appears three times, those are three separate observations when determining the central position.
Finally, rounding too early can produce an inaccurate result. When working with decimal values, keep enough precision during the calculation and round only at the end if the question specifies a number of decimal places. A reliable median average calculator can help verify the result, but the final answer should still be checked against the original data.
Why Use a Median Average Calculator?
A median average calculator is useful when a dataset contains many observations or when accuracy and speed matter. Manually sorting dozens or hundreds of values can be tedious, and counting central positions becomes more difficult as the dataset grows. A calculator can process the list quickly and reduce the likelihood of arithmetic or ordering errors.
It can also help students compare the median with the mean and mode. Seeing all three values together makes it easier to understand the behavior of a dataset. For example, if the mean is much larger than the median, the data may contain unusually high observations or have a right-skewed distribution. If the median is larger than the mean, the distribution may be influenced by unusually low observations. These comparisons provide useful clues, although the three measures alone do not fully describe the shape of the data.
A calculator can also be helpful for checking homework, reviewing examination questions, and exploring statistics concepts. You can enter a dataset, calculate the result manually, and then compare the two answers. If they differ, review the sorting process, the number of observations, and the relevant formula.
For more advanced analysis, some calculators provide quartiles, the interquartile range, and other descriptive statistics. These features allow you to examine both the center and spread of the data rather than relying on one number. Statistical education resources emphasize that a single measure of central tendency may not be enough to describe a complete.
Conclusion
A median average calculator is a practical tool for finding the middle value of an ordered dataset. The process is simple: arrange the numbers, count the observations, and identify the central value or average the two central values when the count is even. Understanding this method helps you solve statistics problems accurately and interpret real-world information more effectively.
The median is only one of the three commonly used measures of central tendency. The mean calculates the arithmetic average, while the mode identifies the most frequently occurring value. Each measure has a different purpose, and the best choice depends on the data and the question you are trying to answer.
You have also learned how to calculate the average percentage of marks, distinguish between a simple and weighted average, and understand the interquartile range. Remember that the range and median alone are generally insufficient to determine the exact mean because they do not reveal the total of all observations. By combining the right formula with a clear understanding of the data, you can use a calculator more confidently and avoid common statistical errors.
Frequently Asked Questions
1. How do you find a median average?
To find the median, arrange the numbers from smallest to largest. If there is an odd number of observations, select the single middle value. If there is an even number of observations, add the two middle values and divide their sum by two. A median average calculator performs this process automatically after you enter the dataset.
2. What is the median of 1, 2, 3, 4, 5, 6, 7, 8, 9, and 10?
There are ten numbers, so the dataset has an even number of observations. The two middle values are 5 and 6. The median is:
Therefore, the median is 5.5.
3. What are the 3 M’s in statistics?
The three M’s commonly refer to the mean, median, and mode. The mean is the arithmetic average, the median is the middle value in ordered data, and the mode is the value that occurs most frequently. These measures help describe the center or typical value of a dataset, but they do not always produce the same answer.
4. How do you find the median of 13, 16, 12, 14, 19, 12, 14, 13, 14?
First, arrange the values:
12, 12, 13, 13, 14, 14, 14, 16, 19
There are nine values, so the median is the fifth value. The fifth value is 14. Therefore, the median is 14.
5. How do you calculate the mean from range and median?
You generally cannot calculate the exact mean using only the range and median. The range gives the difference between the largest and smallest values, while the median gives the central position. To calculate the mean, you need the sum of all observations and the number of observations, or enough additional information to determine that sum.